“After using the Oryl Screener, it is hard for me to get back to the traditional techniques. It’s just too laborious.”

PhD Student at FHNW
Plating of compounds
Addition of solvent
The customer plates the compounds in 384 or 96 well-plates with an acoustic robot (Echo, Labcyte) and sends the plates to Oryl; or the customer sends the compounds to Oryl and Oryl plates the compounds with an acoustic robot.
Direct screening and analysis

Well-plates are directly tested using the Solvent Redistribution method or incubated during a customer-defined incubation time (typically 2 hours) prior to testing.
Report generation and feedback
Reports are generated within 1 week of receipt of samples.
| Type of measurement | Kinetic solubility (1% final DMSO concentration) |
| Liquid dispensing | Echo platform (2.5 nL droplet) |
| Compound consumption | ~2 µL of 10 mM stock solution per solubility datapoint |
| Precisition | std/mean < 5% |
| Sensitivity | < 1 µM |
| Throughput | 384 wellplate in 13 minutes |
| Data delivery | Estimated solubility range, curve analysis |
| Solvent | Standard PBS buffer (alternatives possible: change of pH, with excipients, etc.) |
You have specific requirements for your measurement? Please contact us and we will adjust our offer to your needs.

Solubility measurements comparing the Solvent Redistribution method, laser-based nephelometry and HPLC-UV based methods. For full details of the benchmarking study, visit this page.

Example solubility analysis for 3 replicates of a given compound. The solubility limit is calculated as the concentration at which the threshold is reached. The threshold is defined as mean + 3 * standard deviation of the baseline, with the baseline defined as the intensity of the 2 lowest concentrations.
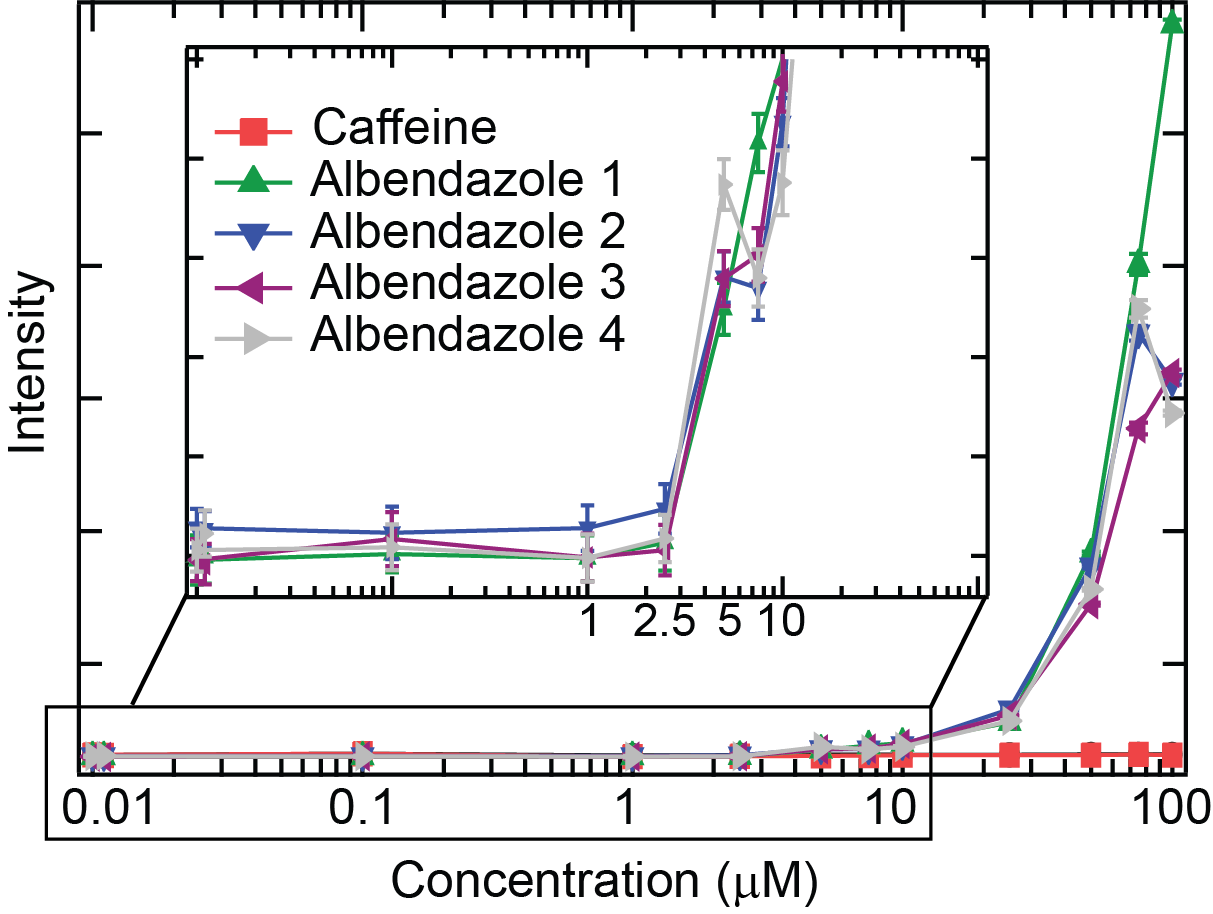
The typical output for a solubility measurement is a plot of intensity vs concentration. For example, the figure below shows the intensity vs concentration plot for a poorly soluble compound, albendazole with n=4 replicates. A control plot of intensity vs concentration is also shown for caffeine that is soluble in the range of concentrations tested.
At concentrations below the solubility limit (<2.5 µM), the intensity is low and constant (which defines the baseline). At concentrations above the solubility limit, the intensity increases. For albendazole, the intensity starts to increase from 1 µM and a clear jump in intensity is visible at concentration above 2.5 µM. For comparison, the intensity of caffeine stays flat, which indicates that caffeine is soluble within this range of concentrations.
A typical measurement report will contain a tabulated summary of the approximate solubility values for each compound, a detailed plot and solubility analysis for each compound, the protocol used for the solubility measurement and a brief explanation of the solvent redistribution method. Additional analysis can be performed on request.
The Solvent Redistribution method is a general and flexible method that looks at how the solvent redistributes as the solute transitions to different stages of aggregation. The method can be performed at different pH, temperature, pressure, salt concentration, etc.
Typical negative control is caffeine (very soluble compound) and typical positive controls are amiodarone and albendazole (poorly soluble > 1 µM).
The Solvent Redistribution method is based on high efficiency second harmonic light scattering (SHS) that probes the anisotropic distribution of solvent molecules (dipolar molecules such as water, DMSO, methanol, etc) around solutes. This unique structural sensitivity makes SHS sensitive to aggregation.
“After using the Oryl Screener, it is hard for me to get back to the traditional techniques. It’s just too laborious.”
PhD Student at FHNW
“Getting a solubility value using minimum amount of compound provides a lot of value. Especially when the compound is very hard to synthesize.”

Organic Chemist